Google Science Journal is a mobile app, available for iOS and Android and Chromebooks that can run apps from the Google Play store. In order to use it with a G Suite for Education account, it must be enabled by a district's Google apps administrator. Regardless of which version used, the app allows the experimenter to use the sensors that are native to the mobile device to collect and record data. These include accelerometers, magnetometer, light sensor, sound sensors, and more. If you use any Bluetooth sensors (like the GoDirect line by Vernier), it's possible that the app can also collect data using those.
When you open the app, you will be prompted to sign in using your Google account. Once you do, a folder called Science Journal will appear in your Google Drive. In addition, the app will sync across multiple devices when a person is logged in to each one, so you can start and experiment on an iPhone and finish it on an iPad.
The uncomplicated app is easy to navigate. Get started by clicking the purple + sign to create a new experiment. This will open a "card" on which you can record information. Add text to record observations or write a hypothesis. Tap the sensor icon to access the sensors and collect data. You can grab a snapshot (one data point) or create a recording (a graph of how a value changes over time). You can also access the camera or insert other images.


If you record a graph, simply tap it to edit or annotate. Text notes can be inserted to show where particular events happened on the graph. The recording can be cropped, shared, archived, or deleted. Cropping is as easy as dragging a slider to the desired location.

Here's an example of an experiment you could do with students. Get some noise making toys (or instruments or objects or whatever). Open the Science Journal and use the Pitch and Sound Intensity sensors to record what happens with these values when the object makes some noise. Grab screenshots of those graphs. Show the objects and the graphs to students and ask them to hypothesize which object created each set of graphs and record the hypotheses in the Journal. Then assign an object to a group of students for further investigation. As students record data, they should annotate the graph to indicate where the pitch or intensity changed and why. Complete the experiment by asking students to make a claim, supported by evidence and reasoning, about which graphs were created by the object the experimented.
We tried this in my SPARCC session today with these objects:

Here are two of the graphs.
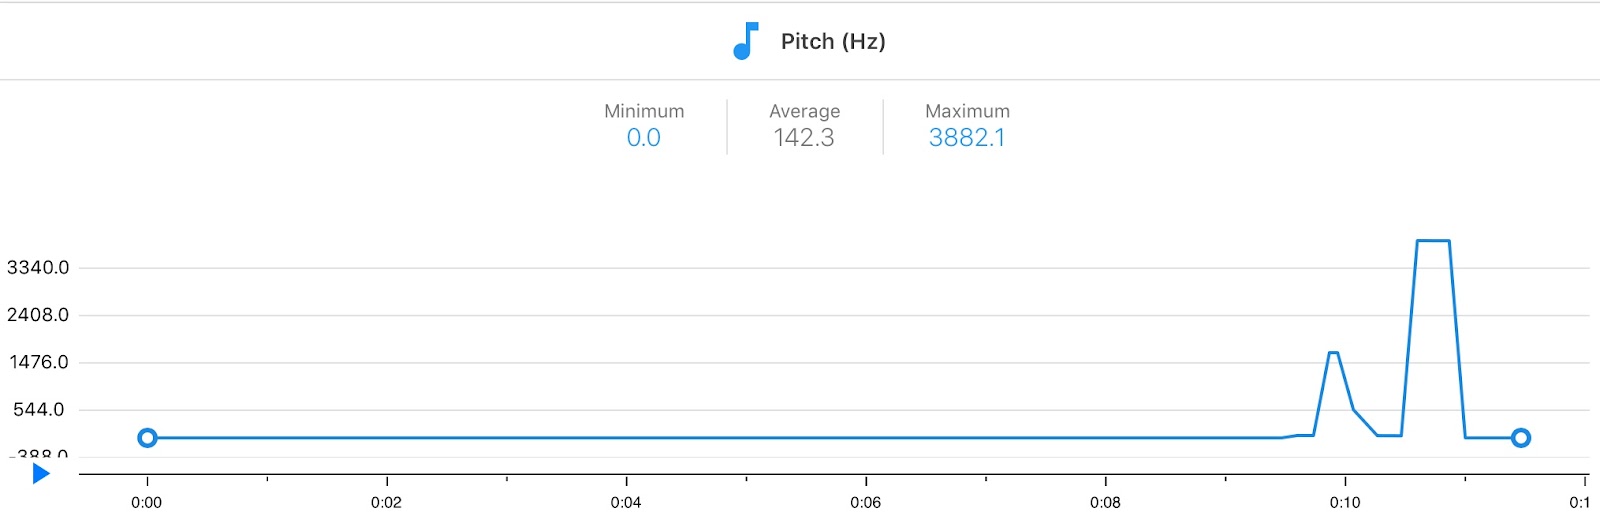
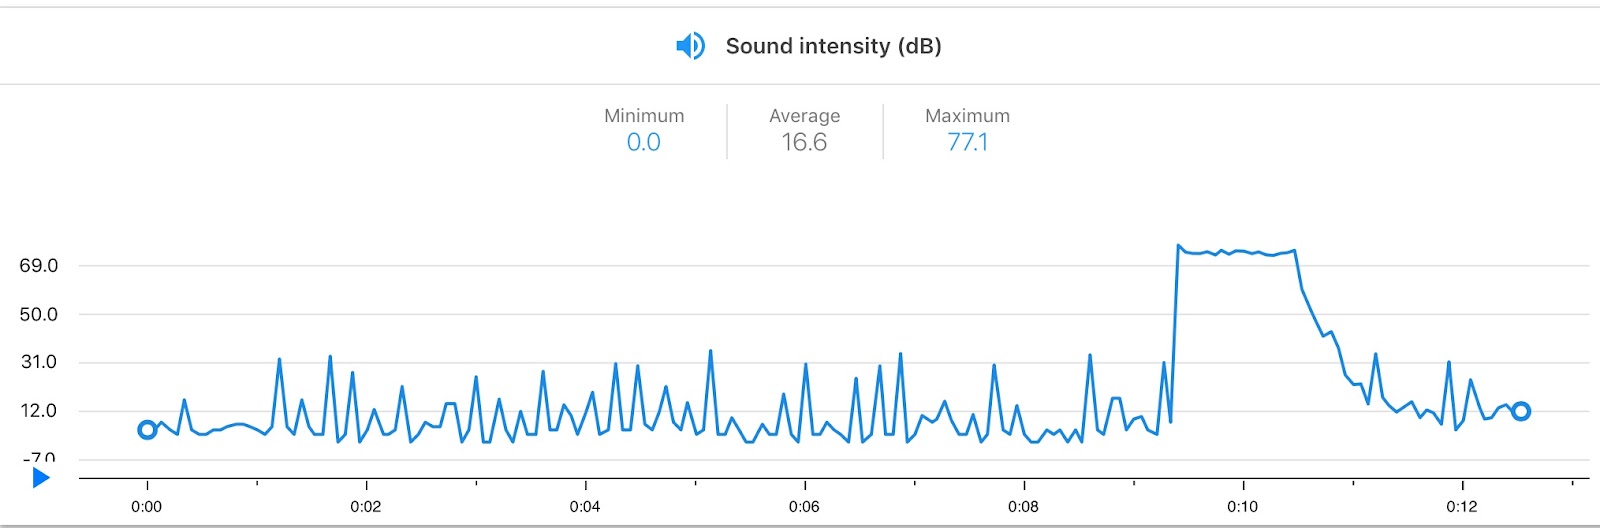
Can you guess which object created these graphs?
When the experiment is complete, it can be exported to Drive as a PDF. Then it could be shared like any other Drive file or turned in through Google Classroom.
There are many possibilities for using this with students, but luckily you don't have to think them all up! Here is a "long list" of experiments that can be searched by level and type of equipment or duration. The experiments are being authored by many reputable science organizations. If you are interested in learning more, you also might want to check out Google's Science Journal support.
Are you using Google Science Journal? Feel free to comment to share your uses.
Super cool!! Love your blog. Thanks for sharing!
ReplyDeleteThanks so much, Lisa! I love reading yours, too!
Delete